Operations ERP Suite
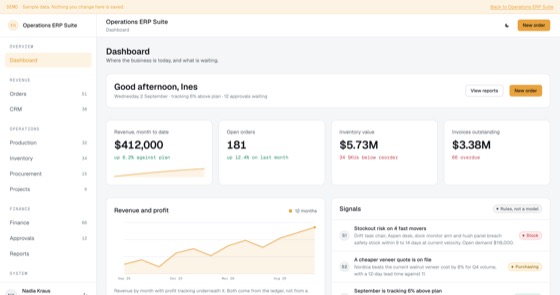
The full ERP spine: orders, CRM, production, stock, purchasing, projects, finance, approvals, reporting, people and automation.
5.0 out of 58 sold
Executive overviewAdmin1 / 8
4.0 out of 52 sold
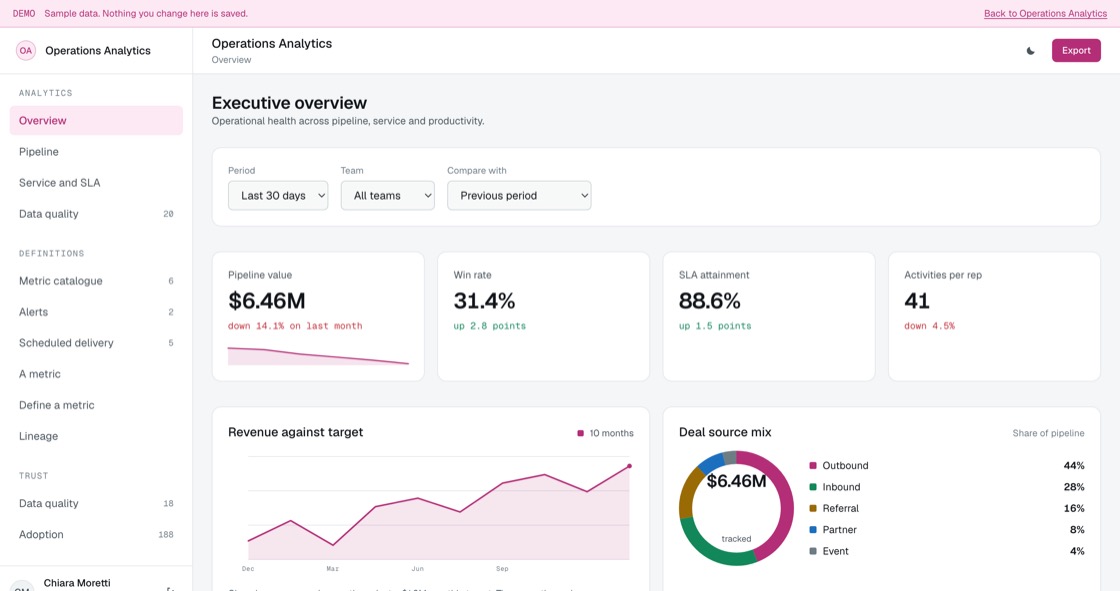
Most reporting arguments are not about the chart. They are about whose definition of the number is right, or about a record with a field missing. This build puts both on screen: every figure resolves to an agreed definition, and the data quality problems have their own page.
From$679
Inside the app
23 connected functions on one schema, spanning three data scopes. Everything below is in the template before a line of customisation.
Pipeline value, win rate, SLA attainment and activity per rep, with revenue against target and the deal source mix. Every figure resolves to a definition.
Stage funnel with deal count, value and time in stage, quota attainment by rep, and deals by owner split into won, open and lost.
Aged against the normal pace of that stage rather than a flat number of days, so a deal is stalled relative to how the stage actually behaves.
First response, resolution time, attainment by priority and backlog by age, with the tickets about to breach named.
Against the target that applied when the ticket was raised. Changing a target does not retroactively improve last quarter.
Completeness by required field, stale open deals, and orphaned owner records left behind by deactivated users, each named rather than silently dropped.
Each definition, its owner, whether it is agreed or in review, and when it changed. A deprecated metric keeps its definition and its history.
Thresholds with a condition, a notification list and a state. A muted alert stays visible and says who muted it and when.
Reports that go out on their own, recorded with the figures they contained, so you can see exactly what somebody was sent last Monday.
Type, schedule, last run and rows loaded. A failed source shows on every screen that depends on it rather than reporting yesterday as today.
Row-level scope applied on the query, two approvals to change a definition, a freshness stamp on every screen, and exports that carry their filters.
An admin sees every team. A manager sees theirs. A rep sees their own deals and tickets. Scope is a WHERE clause, not a hidden menu.
Permissions
A rep sees their own deals and tickets, a manager sees their team, an admin sees the tenant. Scope is applied on the query rather than by hiding navigation, so a narrower role cannot reach wider data by editing a URL.
The build
10 screens, all of them live in the preview. Nothing on this list is a mockup or a roadmap item.
Access
Analytics
Definitions
Administration
What you get
Operations and finance teams who currently rebuild the same figures in spreadsheets every Monday.
Access and evidence
The expensive reporting failure is not a broken chart, it is two teams confidently quoting different numbers for the same thing. Definitions are versioned objects here, so a change is visible rather than silent.
Related
The full ERP spine: orders, CRM, production, stock, purchasing, projects, finance, approvals, reporting, people and automation.
5.0 out of 58 sold
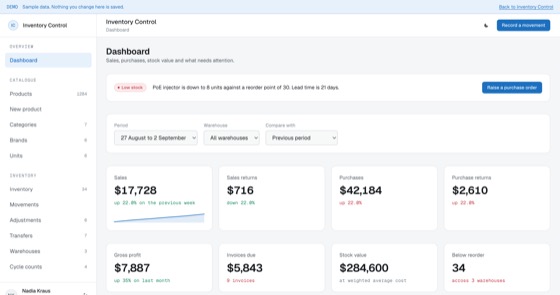
Catalogue, stock, warehouses, purchase orders, suppliers, sales, cycle counts and valuation, on one append-only movement ledger.
5.0 out of 510 sold
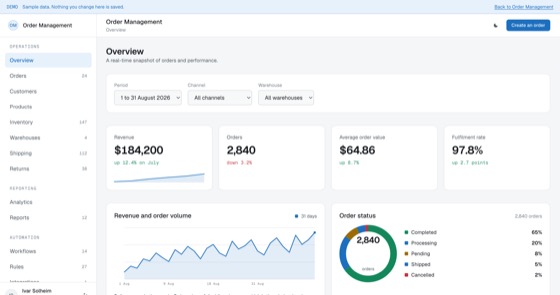
A full order management system: orders, customers, catalogue, stock, warehouses, shipping, returns, automation rules and integrations.
5.0 out of 510 sold
Questions
Not covered here?
Ask a consultant directly. No form to fill in first, and no follow-up sequence.
Book a consultantAll questionsYes. The repository, application code, database schema, migrations, seed data and deployment configuration, is transferred to your organisation on delivery. There is no licence key and nothing that calls home.
As many as you like. Per-seat pricing is the reason most companies ration BI access to the people who least need it. Pricing here is per application, so everyone who should see a number can have a login.
No, and it would be dishonest to claim otherwise. It covers governed operational reporting, agreed definitions, scheduled packs, threshold alerts and source health. If you need ad-hoc exploration across a warehouse by non-technical users, keep your BI tool and use this for the numbers that must be consistent.
Scheduled loads from the systems you already run. A fitted build wires up your order, inventory, finance and HR sources, and the source health screen shows whether each one actually arrived, which is usually the thing that breaks first.
That is the usual route. A fitted build sets up your metric definitions, source connections, report packs, alert thresholds, branding and up to two integrations, and typically takes one to three weeks from a signed scope.
Hosting only, paid to your own cloud provider, roughly $50 to $200 a month, rising with the volume of history you retain. There is no recurring fee to us unless you choose managed hosting.
Start here
A fitted build adjusts fields, stages, roles and integrations to how your team already works. One scoping call, a fixed price, one to three weeks.